
6/22/2023: Earlier this month the DCLT wrapped up its second annual Pond Health Experiment with the students of Dennis-Yarmouth Regional High School (DYRHS). The exercise seeks to provide students with their first experience using the modern scientific method as they learn about the importance of pond ecosystems in Cape Cod and beyond. Over forty students participated from three of Mr. Carl De Puy’s classes to expand upon the existing pond field work conducted in his Ecology and AP Environmental Sciences courses.
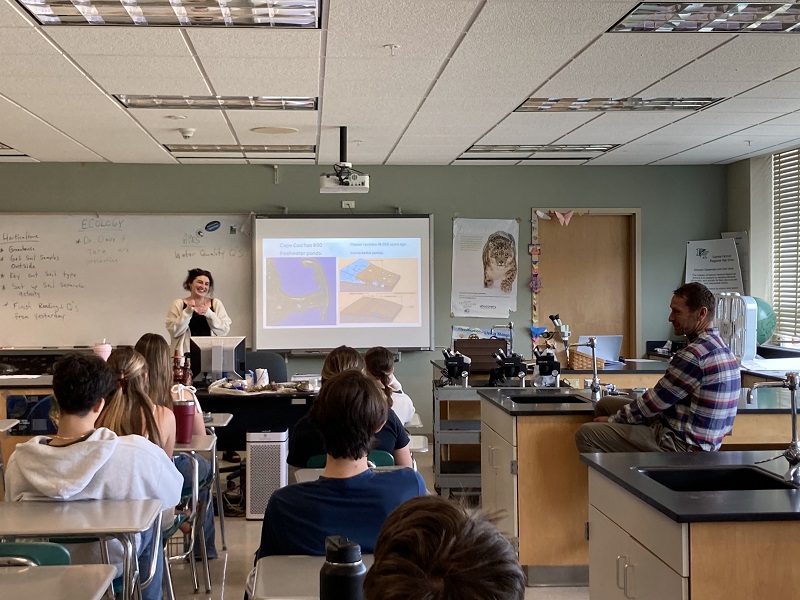
This year the experiment was led by DCLT’s TerraCorps Service Member, Tara Brew. The first class period was devoted to providing background information on ponds and the scientific research process so that students could develop their own hypotheses concerning the drivers of degraded pond health.
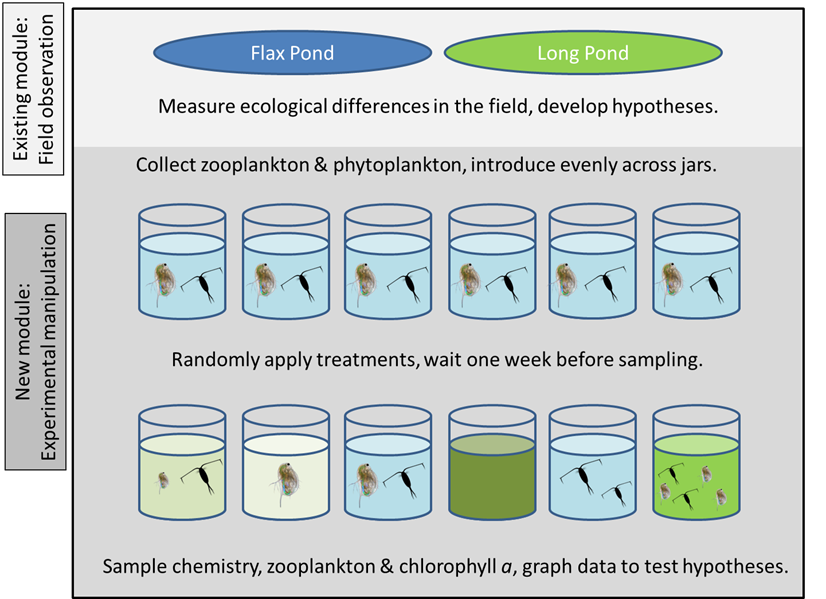
Students then formed small groups in the second class period and were invited to test the impact of a treatment of their choice on the regulatory metrics of pond health: healthy populations of animals (zooplankton), lack of algal blooms (phytoplankton measured as chlorophyll-a), sufficient dissolved oxygen content, and lack of acidified water (circumneutral pH).
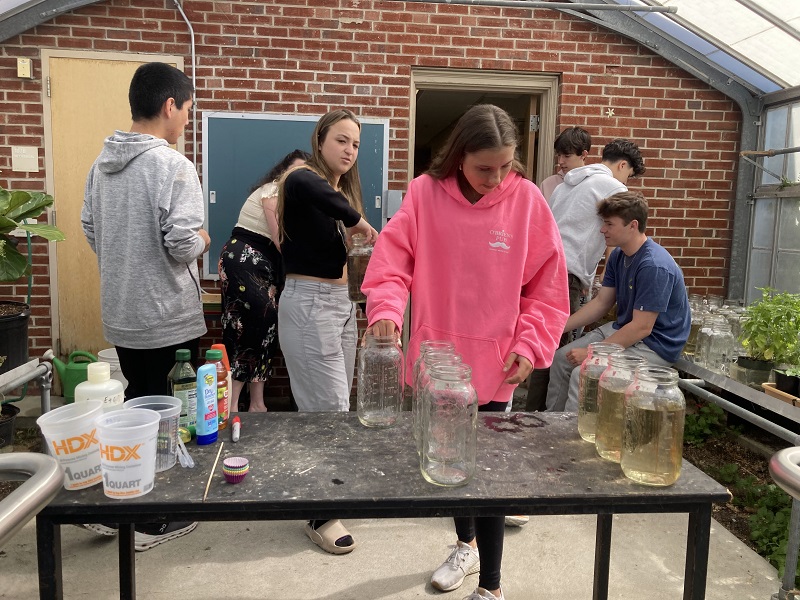
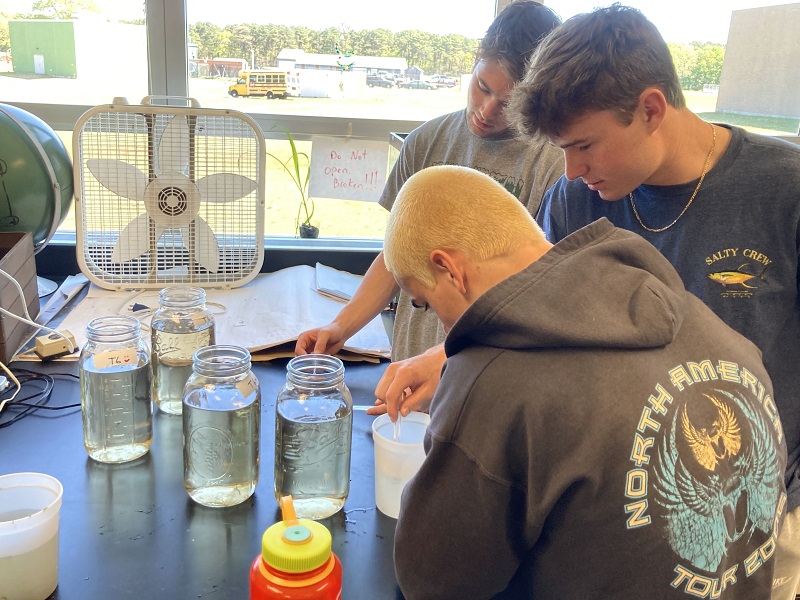
Using glass jars and water collected from actual ponds across Dennis, the students created microcosms of a freshwater pond ecosystem, complete with a two-tiered food chain of animal and plant life.
Once the mini-ponds were established in their new home – the school’s greenhouse – it was time for the students to prepare and apply their treatments. Some groups chose to test the environmental impacts of products humans use every day near or in ponds, such as sunscreen, insect repellent, and fertilizer. Other groups tested ecological hypotheses, choosing to add additional organisms, such as predators (damselfly larvae) or large herbivores (mayfly larvae) to their jars.
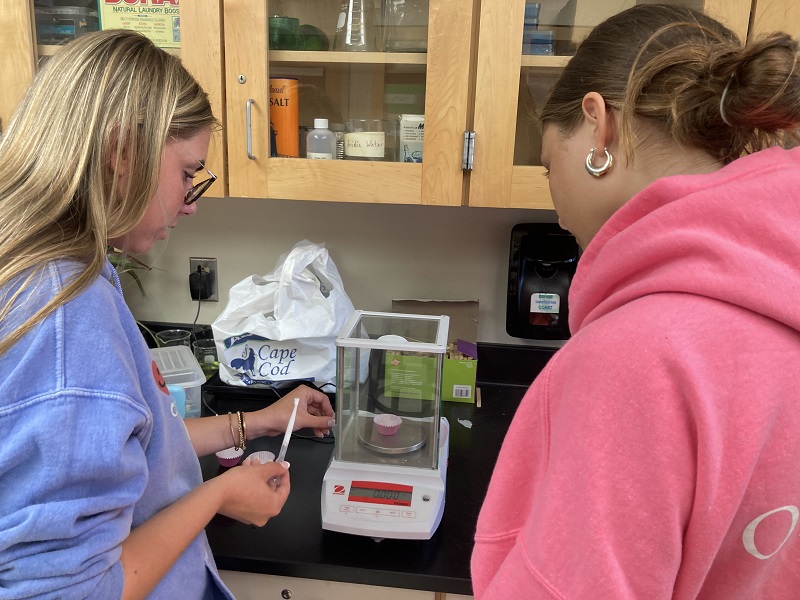
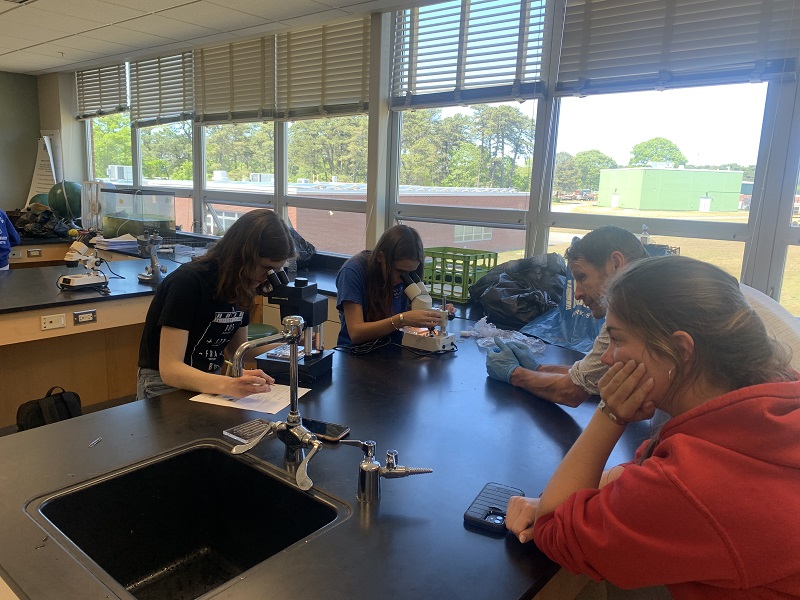
The jars were then left to incubate, and after ten days, groups reconvened for the third class period to collect data. Students measured animal life by counting zooplankton under the microscope, plant life by assessing the chlorophyll-a content with a fluorometer, and dissolved oxygen and pH with their respective electronic meters. Each class had its own set of replicate control (untreated) jars for comparison to treatments.
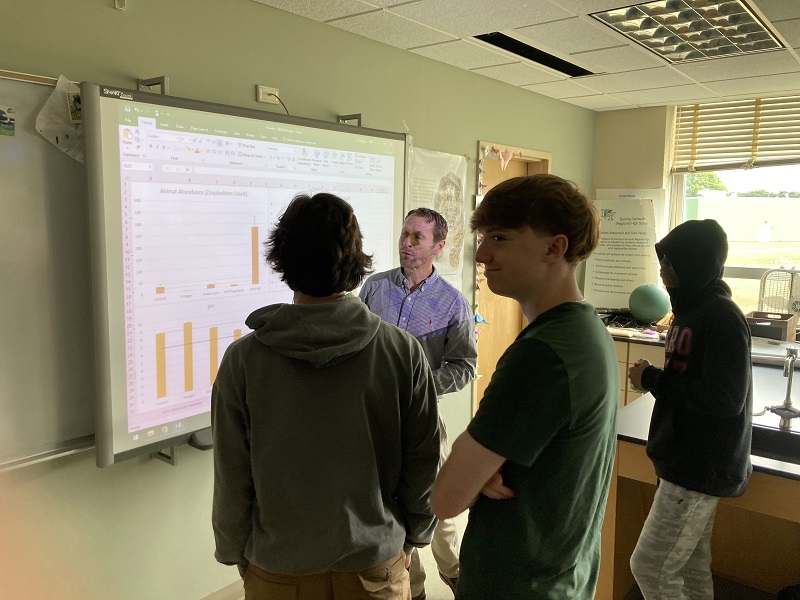
Using a graphing tool developed by the DCLT, the students reviewed graphs of results comparing their treatments to the control group. They learned that simple average differences between treatments and the control were not sufficient to claim statistical support for a hypothesis. Rather, they had to look for nonoverlapping error bars around the treatment and control averages to understand support (or lack thereof) for hypotheses.
While these graphs below may look like a bunch of colorful rectangles, they are much more interesting than that. To orient you, the horizontal axis shows treatment groups with the control group for each class at the far left of that axis. The vertical axis shows the magnitude of the metric of pond health. The solid black line across some of the graphs signifies the Massachusetts State or County upper or lower limit for what constitutes a “healthy pond.”
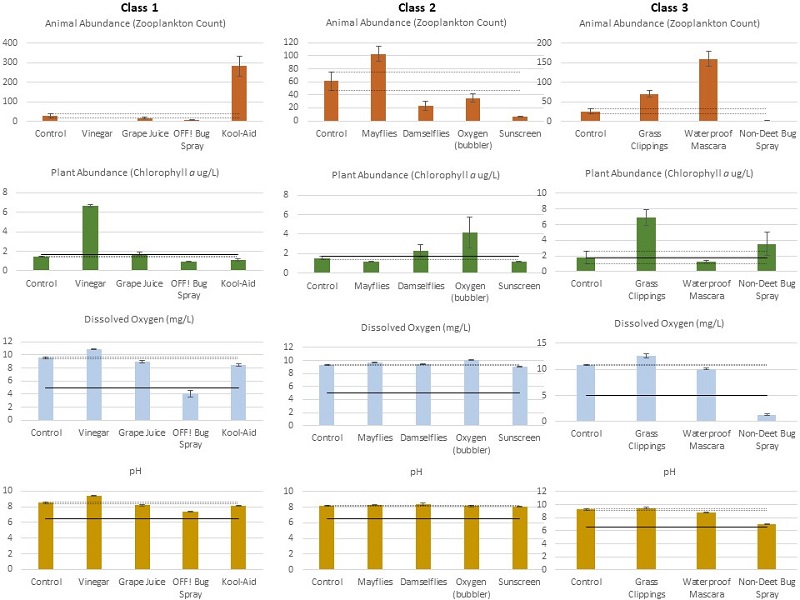
Each of the twelve graphs shows all the data collected in a given class for a particular metric of pond health, e.g. animal abundance, dissolved oxygen, etc. The students found describing the treatment effects on a single metric of pond health to be straightforward – causing no change, an increase, or decrease compared with the control group. However, when the students were asked to think about their overall results considering all four metrics at the same time, it required students to develop interesting, multi-layered stories.
For example… focus on the vinegar data from Class 1 for each of the pond health metrics. That student group sought to test acidic vinegar with the expectation it would decrease pH (i.e. increase acidity) of the water with knock-on consequences for overall pond health. However, compared to the control data, adding vinegar to the pond water actually elevated pH by the end of the experiment, while also causing an increase in plant abundance (i.e. an unhealthy algae bloom) and an increase in dissolved oxygen. The students had to ask themselves – is the vinegar impacting each of these metrics individually, or impacting one of the metrics, which then causes a cascading effect on the rest of the pond health metrics in the ecosystem?
After some serious contemplation, the students developed a plausible explanation for the patterns in their data. They suggested that vinegar wiped out animal populations almost immediately, causing their food – plants – to rise in abundance. The increase in plants meant more photosynthesis in the mini-pond ecosystems, which as a byproduct releases oxygen and sequesters carbon. The students thought that a similar, but opposite effect may have emerged to that of the acidifying effect of increased atmospheric carbon dioxide (e.g. ocean acidification): increased plant photosynthesis removed carbon dioxide from the water, which could potentially increase pH (decrease acidity).
A story like this was derived for each of the groups/treatments studied, the same exercise that is required of any scientist in writing a Discussion section for a peer-reviewed publication. This was the main goal of the experiment – to show students the interconnectedness of all the factors that comprise an ecosystem, and how impacting even one of these factors can have a profound effect on the entire ecosystem. It further showed them that experimental results may often be counterintuitive, but that through the use of the knowledge base they developed over their year of coursework, they could develop cogent stories to explain experimental results.
The DCLT wishes to thank DYRHS and particularly Mr. Carl DePuy for the opportunity to work with their students. We plan to continue running the experiment at least once each year and we are currently collaborating to formalize the activity, with hopes it can be shared and used by teachers elsewhere on Cape Cod and beyond.
The development and implementation of this activity was generously supported by grants to the DCLT from the Horizon Foundation, the Cape Cod Foundation, and the Bilezikian Family Foundation.